


Creating an Organisation Chart in PowerPoint
- Conor Jordan
- Jul 27, 2021
- 2 min read


Organisation Chart
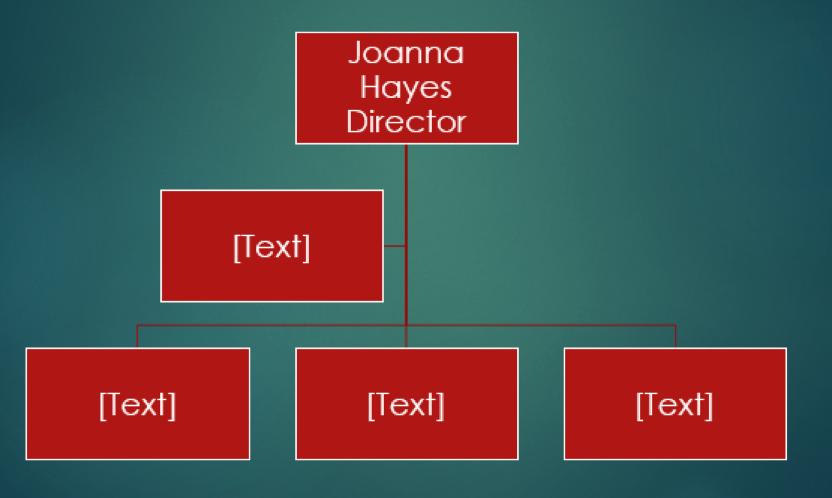
This is an overview of who is in a company or department. Each employee has a place on the chart depending on where they rank in the company or department. It is useful for displaying the structure of a group or company. The organisation chart can be formatted to suit the users needs.
1. Create a blank presentation
2. Insert a new slide using the Title and Content layout
3. Click on Insert a SmartArt Graphic


4. On the left of the dialog box, choose Hierarchy
5. Select Organisation Chart
6. Click OK

7. Click in the Text box to enter text into the organisation chart
8. Hold Shift and press Enter to type beneath the name of the person in the text box
9. Click on the text box below the Director
10. On the SmartArt Tools Design tab in the Create Graphic group, click on Add Shape


11. A new shape has been added to the Organisation Chart
12. Click and drag on the handles around the Organisation Chart to resize it
13. Click on the chart border and move the mouse to move the chart around
14. Click on a Text Box and press the Delete key to remove it
15. On the second row of the chart, click on the Text Box on the right

16. In the Create Graphic group, click on Promote
17. Click on a Text Box on the bottom of the chart
18. On the Home tab in the Clipboard group, select Cut
19. Select the top row of the Organisation Chart
20. On the Home tab in the Clipboard group, select Paste
21. With that Text Box still selected, in the Create Graphic group, click on Demote to move the text box down
22. Save the presentation as ‘Organisation Chart’
For more Advanced PowerPoint tutorials, click on the book image below:


Comments